Updated
Content decay is a slow, lasting drop in a page’s search traffic: the page ranks lower, is shown less, or is clicked less than it was. To spot it, compare each page’s Search Console clicks with an earlier period (the same dates last year if your traffic is seasonal) and count a drop only when it is bigger than normal week-to-week swings. Then refresh, merge or remove the page depending on why it is losing visits.
Why pages decay
- Rankings slip. Newer or better pages overtake yours, or a Google update reassesses the site.
- Google stops showing it for some searches. The page may rank better on fewer searches, losing the long tail it used to pick up.
- Demand falls. Fewer people search for the topic: a season ends, a trend fades, a service changes name.
- Fewer clicks at the same position. A new map pack, AI Overview or ads above you take clicks.
- The page went out of date. Wrong prices, closed businesses, old years in the title.
- Something technical. A noindex, a redirect, a changed canonical or a broken template removes the page or part of a page type from search.
- Your own new page competes with it. See keyword cannibalization.
Real decline vs normal swings
Every page’s clicks bounce around: weekdays vs weekends, holidays, Google reshuffling results. A page with 10 clicks a week can easily drop to 6 one week and recover the next. Calling every dip “decay” fills your to-do list with noise. Two checks separate the two:
1. Is the drop big enough?
Ignore drops of less than 10% of the earlier clicks. Smaller changes are rarely worth a rewrite even when they are real.
2. Is it bigger than chance?
If clicks were pure chance counts, their variance would equal their size. Search clicks vary more than that, roughly twice as much, because of weekdays, holidays and reshuffles. So DirectoryLens measures a drop in standard deviations of normal variation:
z = (earlier clicks - recent clicks) / sqrt(2 x (earlier clicks + recent clicks))and counts it as decay only when z is at least 2. (When the two periods differ in length, the earlier period is scaled to the same number of days first.) The same percentage can pass or fail depending on volume:
| Page | Earlier 28 days | Recent 28 days | Drop | z | Verdict |
|---|---|---|---|---|---|
| Small page | 280 clicks | 240 clicks | 14% | 1.2 | Normal swing |
| Big page | 2,800 clicks | 2,400 clicks | 14% | 3.9 | Real decline |
Worked example with made-up numbers. 280 vs 240: √(2 × 520) ≈ 32, and a 40-click drop is 1.2 of those. 2,800 vs 2,400: √(2 × 5,200) ≈ 102, and a 400-click drop is 3.9.
For a small page that keeps failing the test, use a longer period, or judge it with the other pages of its type.
3. Rule out the season
A ski-rental directory loses traffic every spring. Comparing April with March shows “decay”; comparing April with last April shows the truth. Google’s own guide to traffic drops suggests looking at 16 months of data to spot drops that repeat every year, comparing with the same period last year, and checking queries in Google Trends to see whether the drop is yours or everyone’s (Debugging drops in Google Search traffic). If your traffic has a season, compare year over year.
Find the cause from the numbers
Compare the page’s clicks, impressions, average position and click rate between the two periods. The pattern usually points to the cause; DirectoryLens applies these rules in this order, first match wins:
| Pattern | Likely cause | What to do |
|---|---|---|
| No impressions at all in the recent period | Lost from search: removed, redirected, noindexed or dropped | Inspect the URL; see page indexing issues. |
| Average position 3+ places worse | Ranking loss | Compare with the pages now above you; refresh or strengthen the page. |
| Position 3+ better but impressions down 30%+ | Long tail pruned: Google stopped showing it for lower-ranked searches | Check which searches it lost; often fine if the main ones held. |
| Position within 1 place, impressions down 20%+ | Demand drop | Check the season and Google Trends; usually not the page’s fault. |
| Under 10 clicks in the earlier period | Low volume | Too few clicks to name a cause; look at the page type instead. |
| Shown as often, clicked less | Click rate loss | Check the title, the snippet and new features above you; see organic CTR. |
These are patterns, not proof. Confirm in Search Console by comparing the page’s queries between the two periods.
Decay by page type
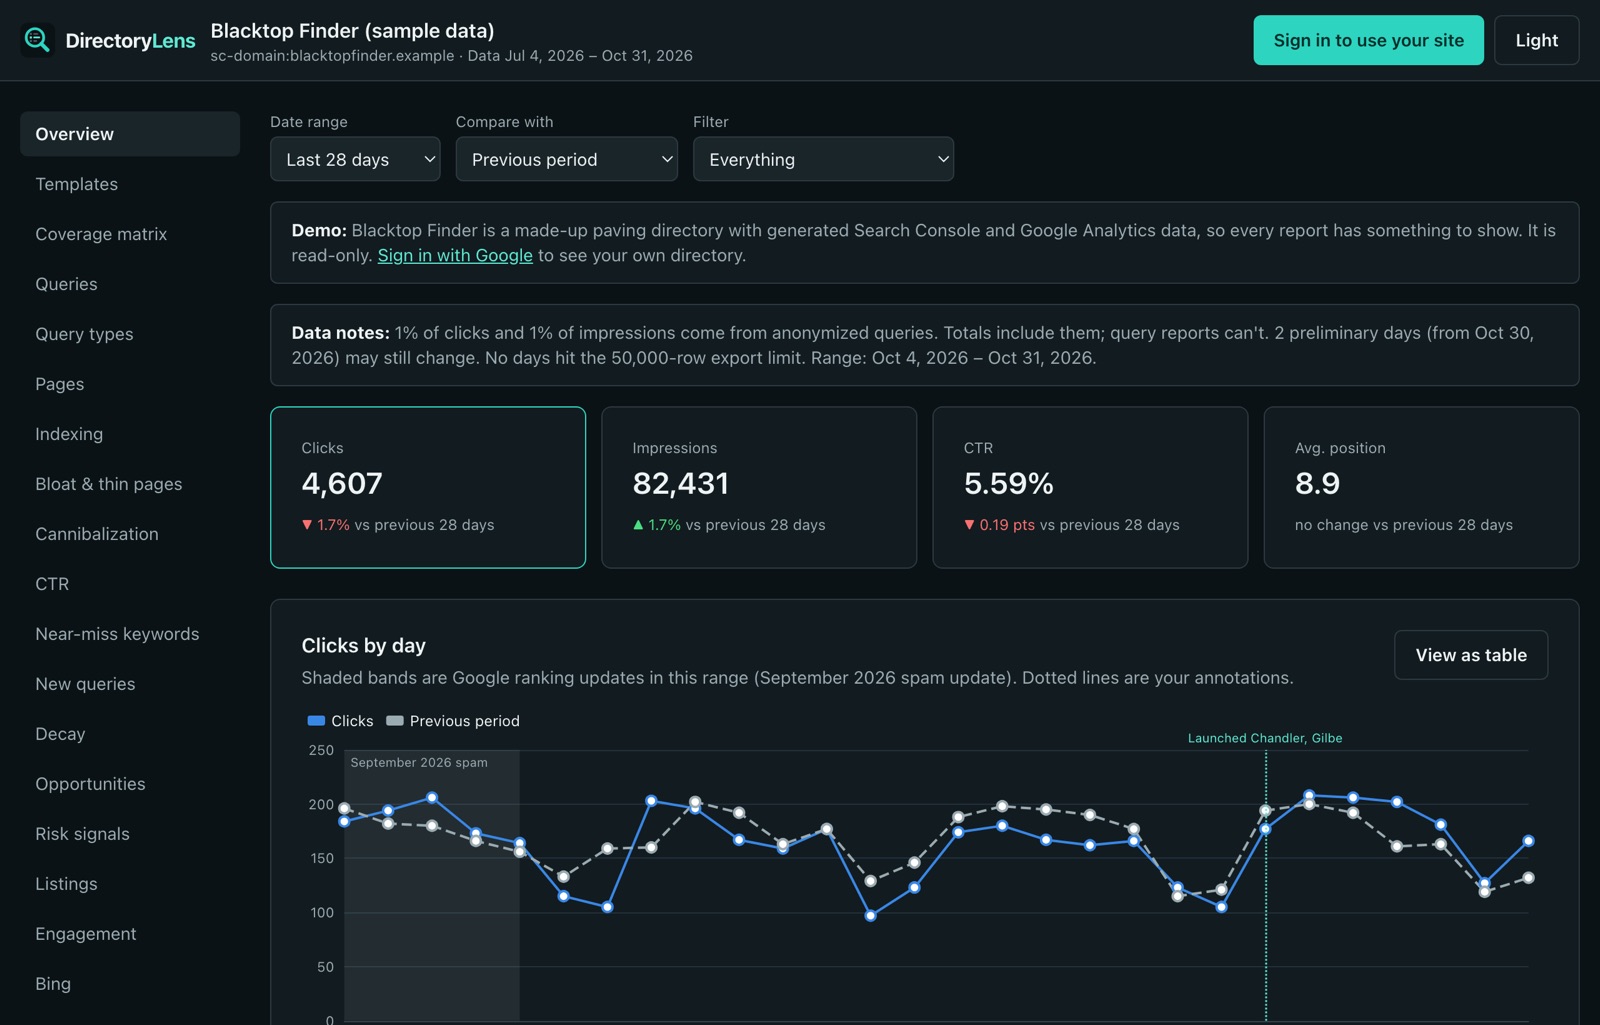
One page losing visits is a page problem. A whole page type losing visits is a template, site or Google problem, and fixing pages one by one won’t help. Add up clicks per page type for both periods and run the same test on the totals. Then look at the daily trend for the page type that dropped:
- A step: most of the drop happens in a day or two. Something changed: a template release, a redirect, a robots.txt edit, a Google update. Check what shipped that day.
- A slope: the drop builds over weeks. Competitors, freshness, or demand.
If the step lines up with a Google core update, see core update recovery. If it lines up with a site change, see the migration checklist.
What to do: refresh, consolidate or prune
Content refresh
For pages that still deserve to rank: update facts, prices and years, add what the pages now outranking you cover, fix the title if the click rate dropped, and add internal links from pages that rank. Change the date only when the content really changed; Google’s helpful content guidance calls out updating dates to look fresh as a warning sign.
Consolidate
Two weaker pages on one topic (often after years of publishing) can become one strong page. Merge the content into the better URL and 301 redirect the other (Google on redirects).
Content pruning
Remove or noindex pages with no purpose left: expired events, closed businesses, empty categories. Do it because the pages don’t help anyone, not because they are old. Google’s Search Liaison has said deleting content just because it is old won’t help (Search Engine Land’s report). Redirect pages that have links or traffic to the closest useful page; let truly dead ones return 404 or 410. More in index bloat and zombie pages.
Leave it alone
If the drop is seasonal, is a demand drop the whole market shares, or is a normal swing by the test above, don’t rewrite the page. Rewriting a page that was fine is a good way to make it worse.
On a directory
- Listing pages decay when businesses close, move or stop updating, and when the business’s own site starts outranking you for its name. Check for closed listings first.
- Category-in-city pages decay when listings leave and the page thins out, or when a competitor directory adds more businesses for that city.
- City hubs often show demand drops tied to seasons (moving, landscaping, snow removal).
- Whole page types drop in a step after template or URL changes. Compare the drop date with your release log.
Group by state and category too. A drop in every Texas page, or every roofing page, points to demand or one competitor, not to your templates.
How DirectoryLens does it
Fix > Traffic drops compares the dates you pick with the period before or, in year-over-year mode, the same dates a year earlier (DirectoryLens imports 16 months on connect, so year over year works from the start). It lists a page, page type, state or category only when it lost at least 10% of its earlier clicks and the loss is at least 2 standard deviations of normal variation, with the variance doubled as above; smaller dips are counted as normal variation, not listed.
Each drop gets a severity (severe: more than 50% and at least 5 clicks; moderate: more than 20% and at least 2) and a likely cause from the table above. Select a page type for its daily clicks over up to 180 days, with the points where the trend changed (segments of at least 14 days) and whether each change was a step or gradual, plus Google updates in the same span. The Overview and Alerts raise the biggest drops; the same analysis is available to AI assistants through the Search Console MCP server. For other quick wins after you’ve stopped the losses, see SEO quick wins.