Updated
A Google Search Console dashboard is one screen that shows how your site is doing in Google Search: clicks, impressions, click rate and position over time, plus the pages and searches behind any change. Search Console’s own Performance report is a good start, but it shows one long list of URLs, keeps 16 months and exports 1,000 rows at a time. For a real dashboard, connect Search Console to Looker Studio, a BigQuery export or a tool that stores the data and groups pages the way your site is built.
What the Google Search Console Performance report shows
The Performance report (Performance > Search results) is Search Console’s built-in dashboard. It has four numbers and six ways to slice them:
| Part | What you get |
|---|---|
| Metrics | Clicks, impressions, average CTR and average position, as a chart and a table. |
| Dimensions | Queries, pages, countries, devices, search appearance and dates. |
| Search type | Web, image, video and news, plus Web (multimodal) for Lens and Circle to Search. |
| Date range | From the last 24 hours (hourly) up to 16 months, with a compare mode for two periods. |
| Filters | Query and page filters with “contains”, “exact” and regex matching, plus country, device and search appearance. |
| Newer additions | A branded queries filter for eligible properties (November 2025), custom chart annotations, and AI-built query groups in Search Console Insights for large sites. |
That covers most day-to-day questions: did clicks drop, which page lost them, which searches moved. Where it runs out is below.
What the built-in report can’t do
- 16 months, then the data is gone. Search Console keeps 16 months of performance data (Google). Year-over-year comparisons work for four months at most, and you can’t look back at last year’s core update once it ages out. The only fix is to copy the data somewhere every day.
- 1,000 rows at a time. The table and the export from the interface stop at 1,000 rows (Google’s deep dive on performance data). The API and the Looker Studio connector go further, up to about 50,000 rows per day per search type. A site with 20,000 pages never sees most of them in the interface.
- No grouping by page type. You can filter pages with regex one group at a time, but you can’t see listings, city pages and blog posts side by side with their own totals and trends.
- Anonymized queries. Searches made by fewer than a few dozen people over two to three months are hidden to protect privacy. They count in the chart totals but never appear as rows, so the query table adds up to less than the total, and any query filter drops them. On long-tail sites, like directories, that hidden share can be large.
- Average position is easy to misread. It is the average of your topmost position each time you were shown, across every location and device. See how keyword rankings work in Search Console.
- No alerts for drops. Search Console emails you about indexing and security issues, not about a page type that lost 30% of its clicks last week.
- Access means Search Console access. To show someone the report you either add them as a user or share a link to one report view.
Your options for a Search Console dashboard
| Option | Good for | Watch out for |
|---|---|---|
| Performance report | Quick checks, one query or page at a time | 16 months, 1,000 rows, no page groups, no alerts |
| Looker Studio | Free custom charts, shared reports, Search Console next to Google Analytics | Live queries against Google, so still 16 months; slow on big sites; you build and maintain it |
| Google Sheets or API scripts | Exact numbers you control, saved daily | You write and run the code; API row limits per day |
| BigQuery bulk export | Every row except anonymized queries, kept as long as you pay to store it | Starts from the day you set it up (no backfill), needs SQL and a Google Cloud project; only owners can set it up (Google) |
| Third-party tools | History beyond 16 months, alerts, grouping and reports without building anything | A subscription; check what access they ask for |
Google itself publishes a Looker Studio template that puts Search Console clicks next to Google Analytics sessions. It is a sensible free starting point, and the guide to Search Console vs Google Analytics explains why the two never match.
Build a free one in Looker Studio
- Open Looker Studio, create a blank report and add data: choose the Search Console connector.
- Pick your property, then the table: Site Impression (totals by property, the same as the Performance chart) or URL Impression (by page, needed for anything per page). Choose the search type, usually Web.
- Add a time-series chart of clicks and impressions, a scorecard row with a comparison date range, and a table of queries or landing pages.
- To group pages, add a calculated field with
CASE WHEN REGEXP_MATCH(Landing Page, ".*/listing/.*") THEN "Listings" ... ENDand use it as a dimension. - Share the report with view access. Viewers don’t need Search Console access, but the report only ever shows the 16 months Google keeps.
It works well for a few pages and a few charts. On large sites it gets slow, and the page-type field has to be maintained by hand every time the URL structure changes.
What a good Search Console dashboard should show
Whatever you build it with, these are the views that turn numbers into decisions:
- One sentence on the last 28 days. Clicks, impressions and the change against the 28 days before, using only days Google has finished counting. The newest two or three days are preliminary and make every comparison look like a drop.
- Clicks by page type. Group URLs by template (for a directory: listings, city pages, category pages, category × city pages, blog) and show each group’s clicks, impressions, position and trend. A slow leak across 900 city pages only shows up here.
- Where you are close to more traffic. Searches where you rank roughly 5 to 20 with real impressions. See striking distance keywords.
- Click rate against position. Pages that get fewer clicks than their position usually earns are a title and snippet problem. See organic CTR by position.
- Brand vs everything else. Brand searches hide what SEO is doing. See branded vs non-branded keywords.
- Pages losing traffic, with the day it started. See content decay.
- Indexing next to traffic. A page type whose share of indexed pages is falling will lose clicks next. See page indexing issues.
- Other sources. Bing Webmaster Tools and visits from AI assistants, so a Google-only view doesn’t hide a shift. See Bing indexing and the AI Overview tracker guide.
Search Console dashboard for a directory website
A directory is a handful of templates repeated thousands of times, so the URL list in Search Console is almost useless on its own. The useful questions are about groups: are listing pages gaining or losing, which cities grew, which category × city pages get impressions and no clicks, which listings got the most searches. Set up page types first (for example /listing/joes-plumbing as a listing, /plumbers/austin-tx as category × city) and every other number gets clearer.
How DirectoryLens works as a Search Console dashboard
DirectoryLens is one of the third-party options. You sign in with Google and pick your Search Console properties; it asks Google for read-only access. It imports the 16 months Google keeps, then saves every day after that, so your history keeps growing past Google’s limit. It pulls each day with the API rather than the 1,000-row interface, and marks how much of each day’s traffic came from anonymized searches.
- Overview: one plain sentence on the last 28 finished days, the numbers behind it and the few things to do next.
- Page types: rules group your URLs (listings, city pages, categories, blog), and every report splits by them.
- Search performance and Searches and pages: every Google number by day, page type, device and country, with CSV export.
- Alerts: drops and indexing problems, in the app, in a Monday email digest, and in Slack or a webhook if you add one.
- Google indexing: index share by page type from Google’s URL Inspection API.
- Bing and Visitor actions: Bing Webmaster Tools next to Google, and Google Analytics contact clicks and AI-assistant visits.
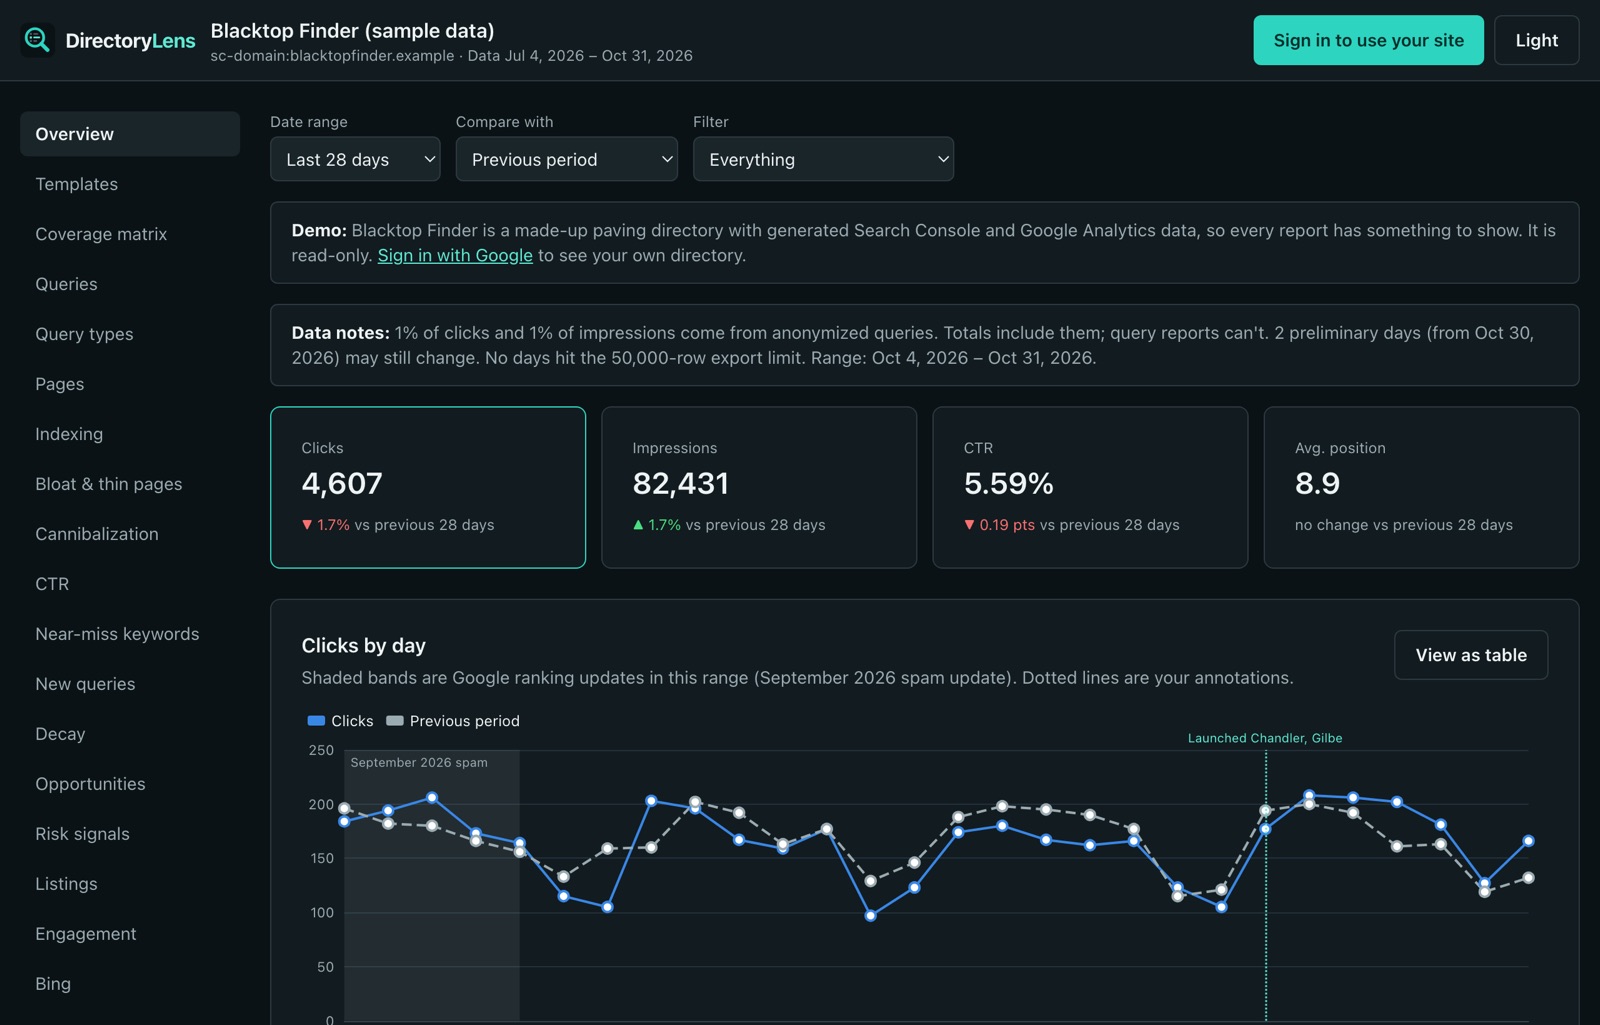
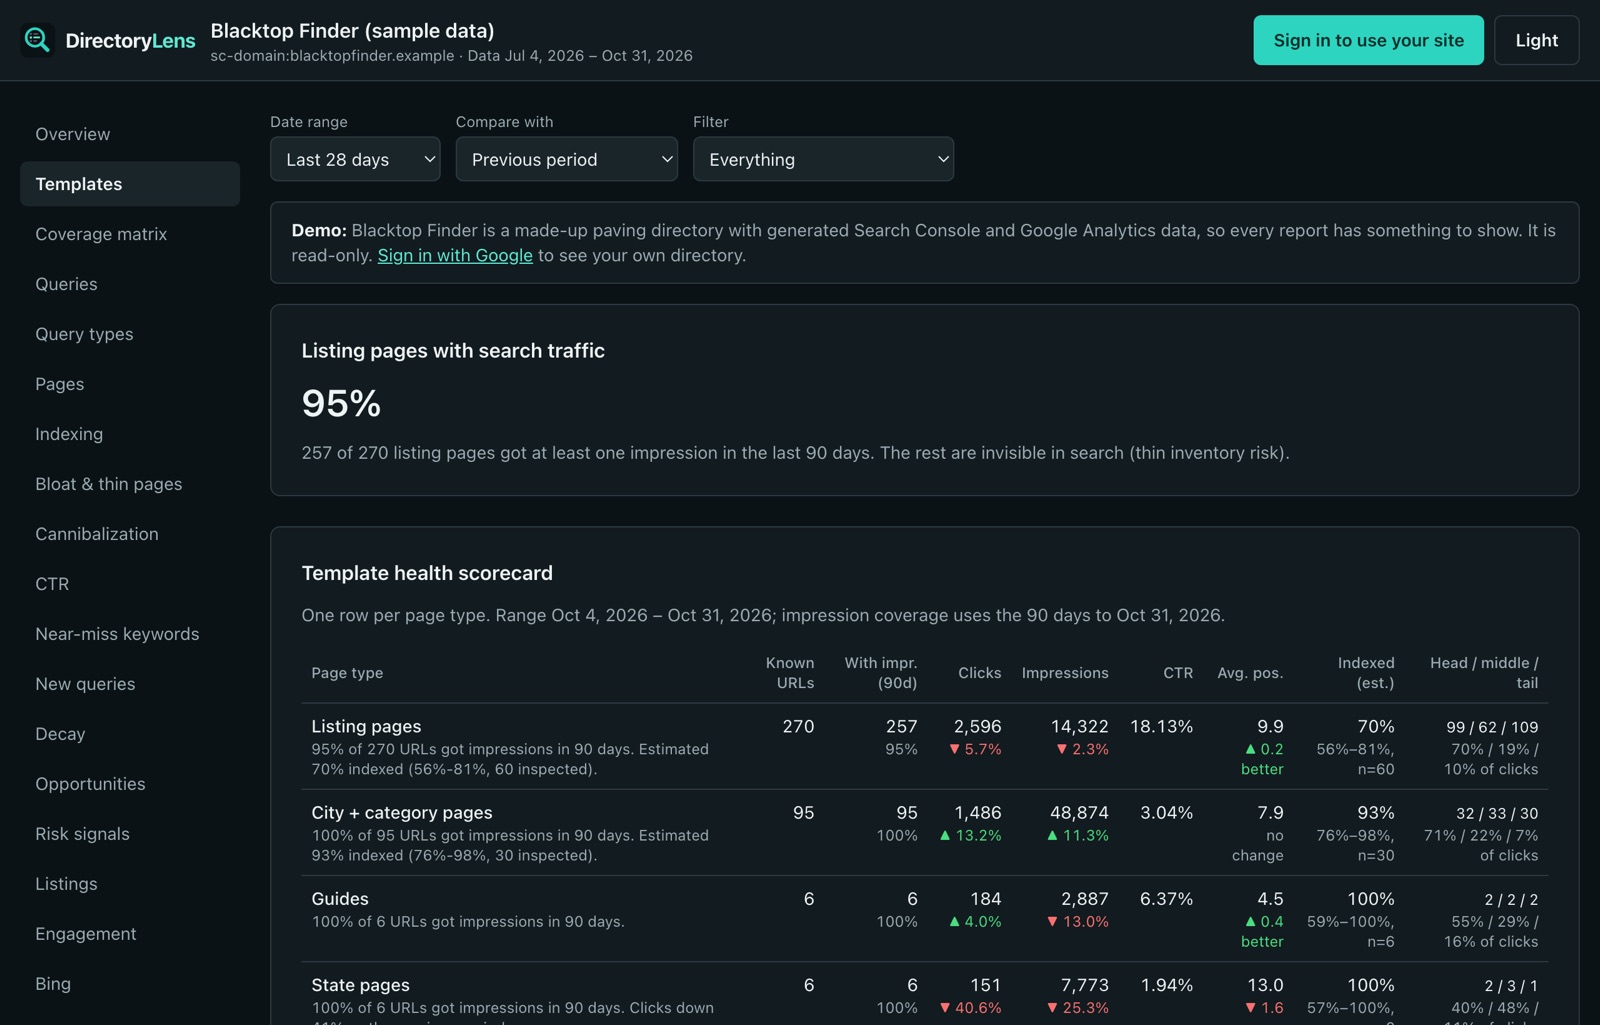
It also works for regular websites (set the site up as a website and the directory-only reports are hidden), and every report is available to Claude or ChatGPT through the Search Console MCP server. You can try it on the live demo without signing in.
What it doesn’t do: it can’t show anonymized queries (nobody can; Google never shares them), and it doesn’t replace Search Console for settings such as submitting sitemaps, removals or requesting indexing.